CSR and Transitions

Calculating the carbon footprint of transportation
The modal comparator
The modal comparator is an essential tool for understanding the orders of magnitude between different modes of transport, and also for realizing the extent to which the choice of mobility has an impact on the environment.
Taking the train in France means an average 90% reduction in CO2e emissions for an equivalent journey by road or air*.
* comparison on complete perimeters. Average figure. Air travel is only compared with the TGV.
Long-distance carbon comparator (gCO2e/passenger/km)
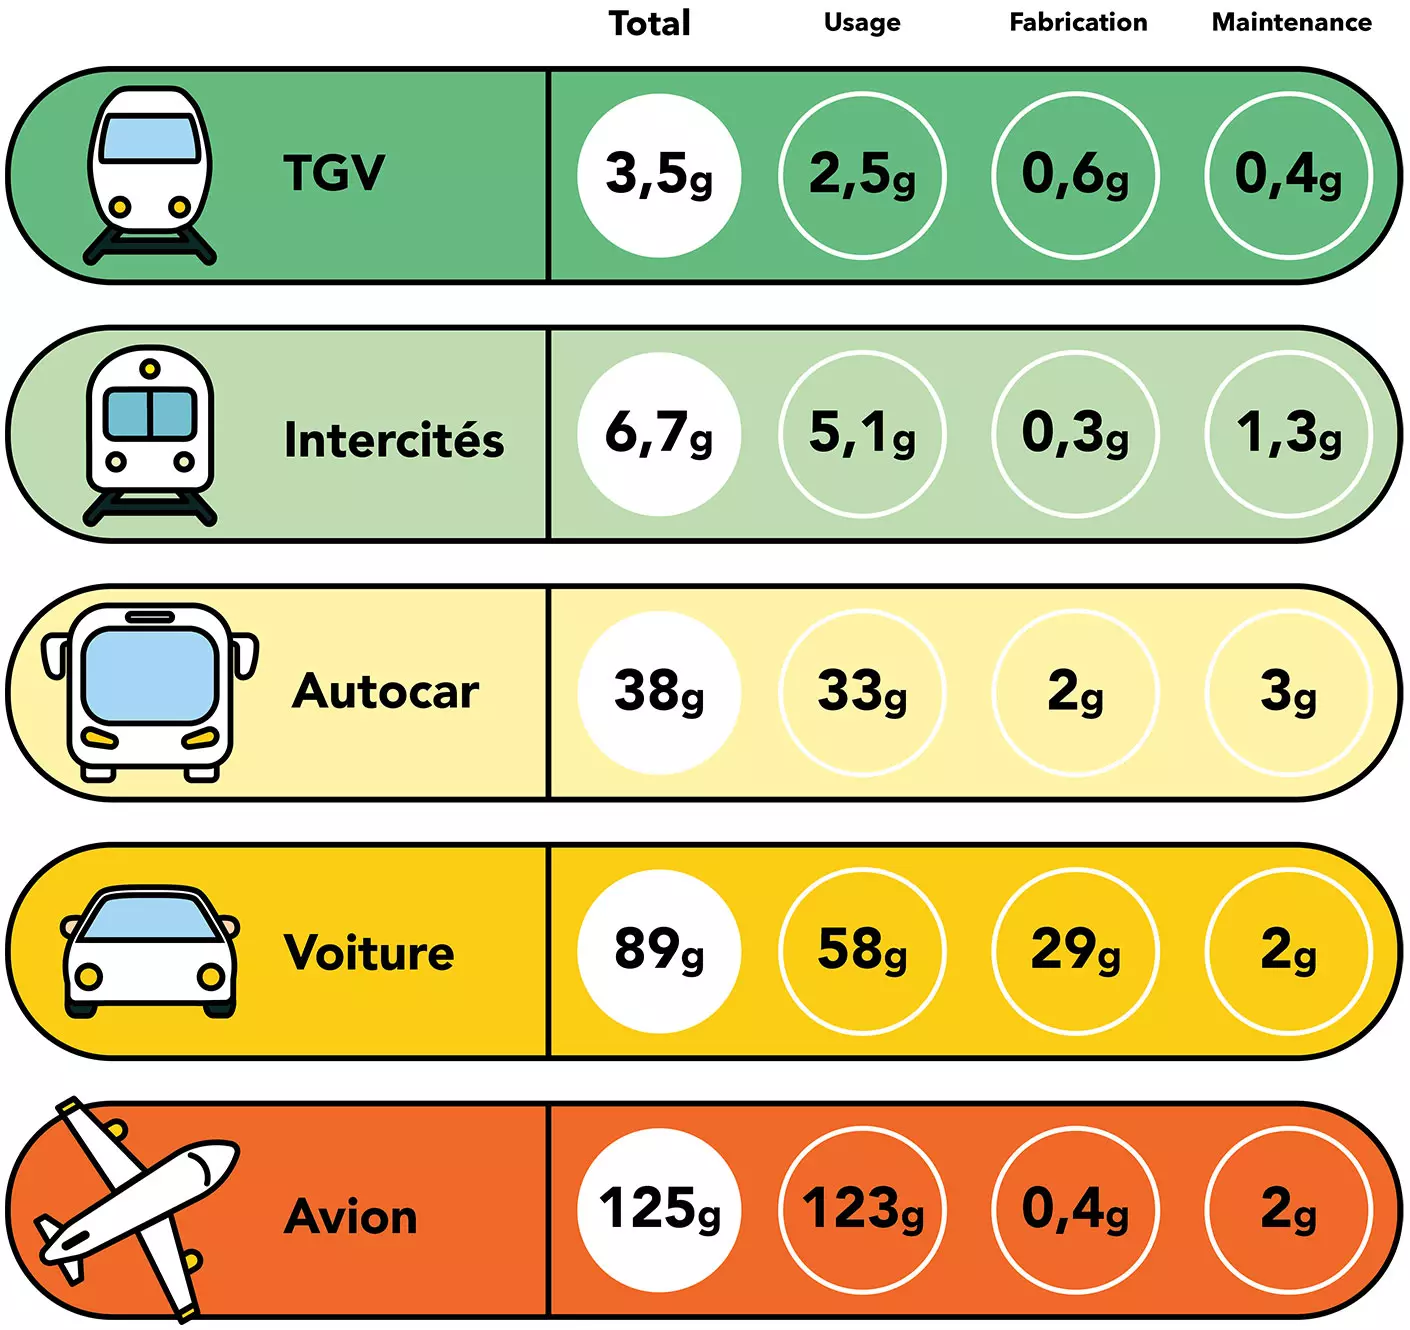
Table showing greenhouse gas emissions for a passenger traveling one kilometer in France, taking into account the impact of vehicle use, manufacture and maintenance (gCO2e/Passenger/Kilometer).
Comparison of data, in ascending order:
- TGV (3.5 grams of CO2e in total, including 2.5 grams of CO2e for use; 0.6 grams of CO2e for manufacture; 0.4 grams of CO2e for maintenance)
- Intercités (6.7 grams of CO2e in total, including 5.1 grams of CO2e for use; 0.3 grams of CO2e for manufacturing; 1.3 grams of CO2e for maintenance)
- Coach (38 grams of CO2e in total, including 33 grams of CO2e for use; 2 grams of CO2e for manufacture; 3 grams of CO2e for maintenance)
- Car (89 grams of CO2e in total, including 58 grams of CO2e for use; 29 grams of CO2e for manufacturing; 2 grams of CO2e for maintenance)
- Plane (125 grams of CO2e in total, including 123 grams of CO2e for use; 0.4 grams of CO2e for manufacturing; 2 grams of CO2e for maintenance).
For the car mode, the data is based on a mix of electric and combustion-powered cars. An occupancy rate of 2.2 passengers is applied, corresponding to long-distance travel.
For SNCF Voyageurs transport modes, 2024 values for use, manufacture and maintenance (maintenance-related emissions include only the energy consumed in maintaining our trains).
For other modes, ADEME Base Empreinte values for use and manufacturing, and Carbone 4 study values for SNCF for maintenance.
Discover our focus on long-distance travel with TGV INOUI's "Planète Voyages" approach.
Short- and medium-haul carbon comparator (gCO2e/traveller/kilometre)
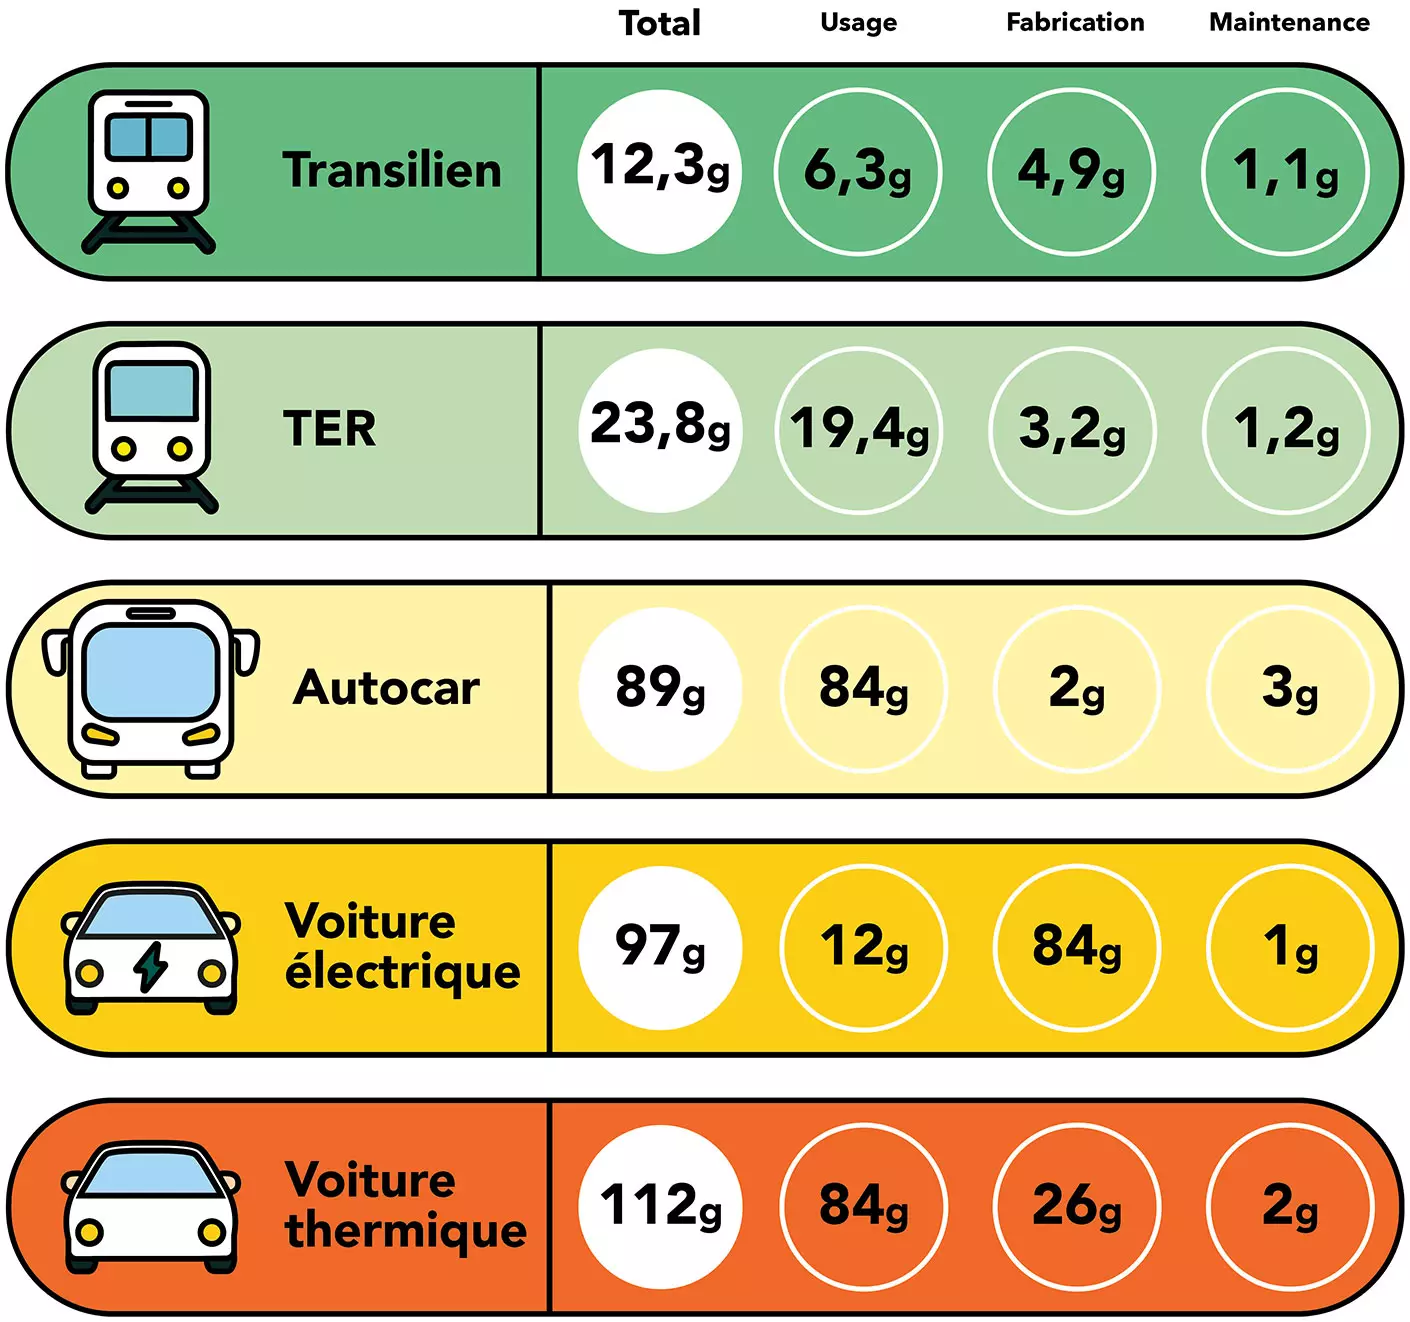
Table showing greenhouse gas emissions for a passenger traveling one kilometer in France, taking into account the impact of vehicle use, manufacture and maintenance.
Comparison of data, in ascending order:
- Transilien (12.3 grams of CO2e in total, including 6.3 grams of CO2e for use; 4.9 grams of CO2e for manufacture; 1.1 grams of CO2e for maintenance)
- TER (23.8 grams of CO2e in total, including 19.4 grams of CO2e for use; 3.2 grams of CO2e for manufacturing; 1.2 grams of CO2e for maintenance)
- Coach (89 grams of CO2e in total, including 84 grams of CO2e for use; 2 grams of CO2e for manufacture; 3 grams of CO2e for maintenance).
- Electric car (97 grams of CO2e in total, including 12 grams of CO2e for use; 84 grams of CO2e for manufacturing; 1 gram of CO2e for maintenance).
- Thermal car (112 grams of CO2e in total, including 84 grams of CO2e for use; 26 grams of CO2e for manufacturing; 2 grams of CO2e for maintenance)
For SNCF Voyageurs transport modes, 2024 values for use, manufacturing and maintenance (maintenance-related emissions include only the energy used to maintain our trains).
For other modes, ADEME Base Empreinte values for use and manufacturing, and Carbone 4 study values for SNCF for maintenance.
For car modes, an occupancy rate of 1.6 passengers is applied, corresponding to medium-distance travel.
The figure for coaches is calculated on the basis of an average of the three types of coach (long-distance, intercity and Île-de-France), weighted by the actual distances covered.
Carbon comparator of SNCF Voyageurs rail carriers (gCO2e/passenger/kilometer)
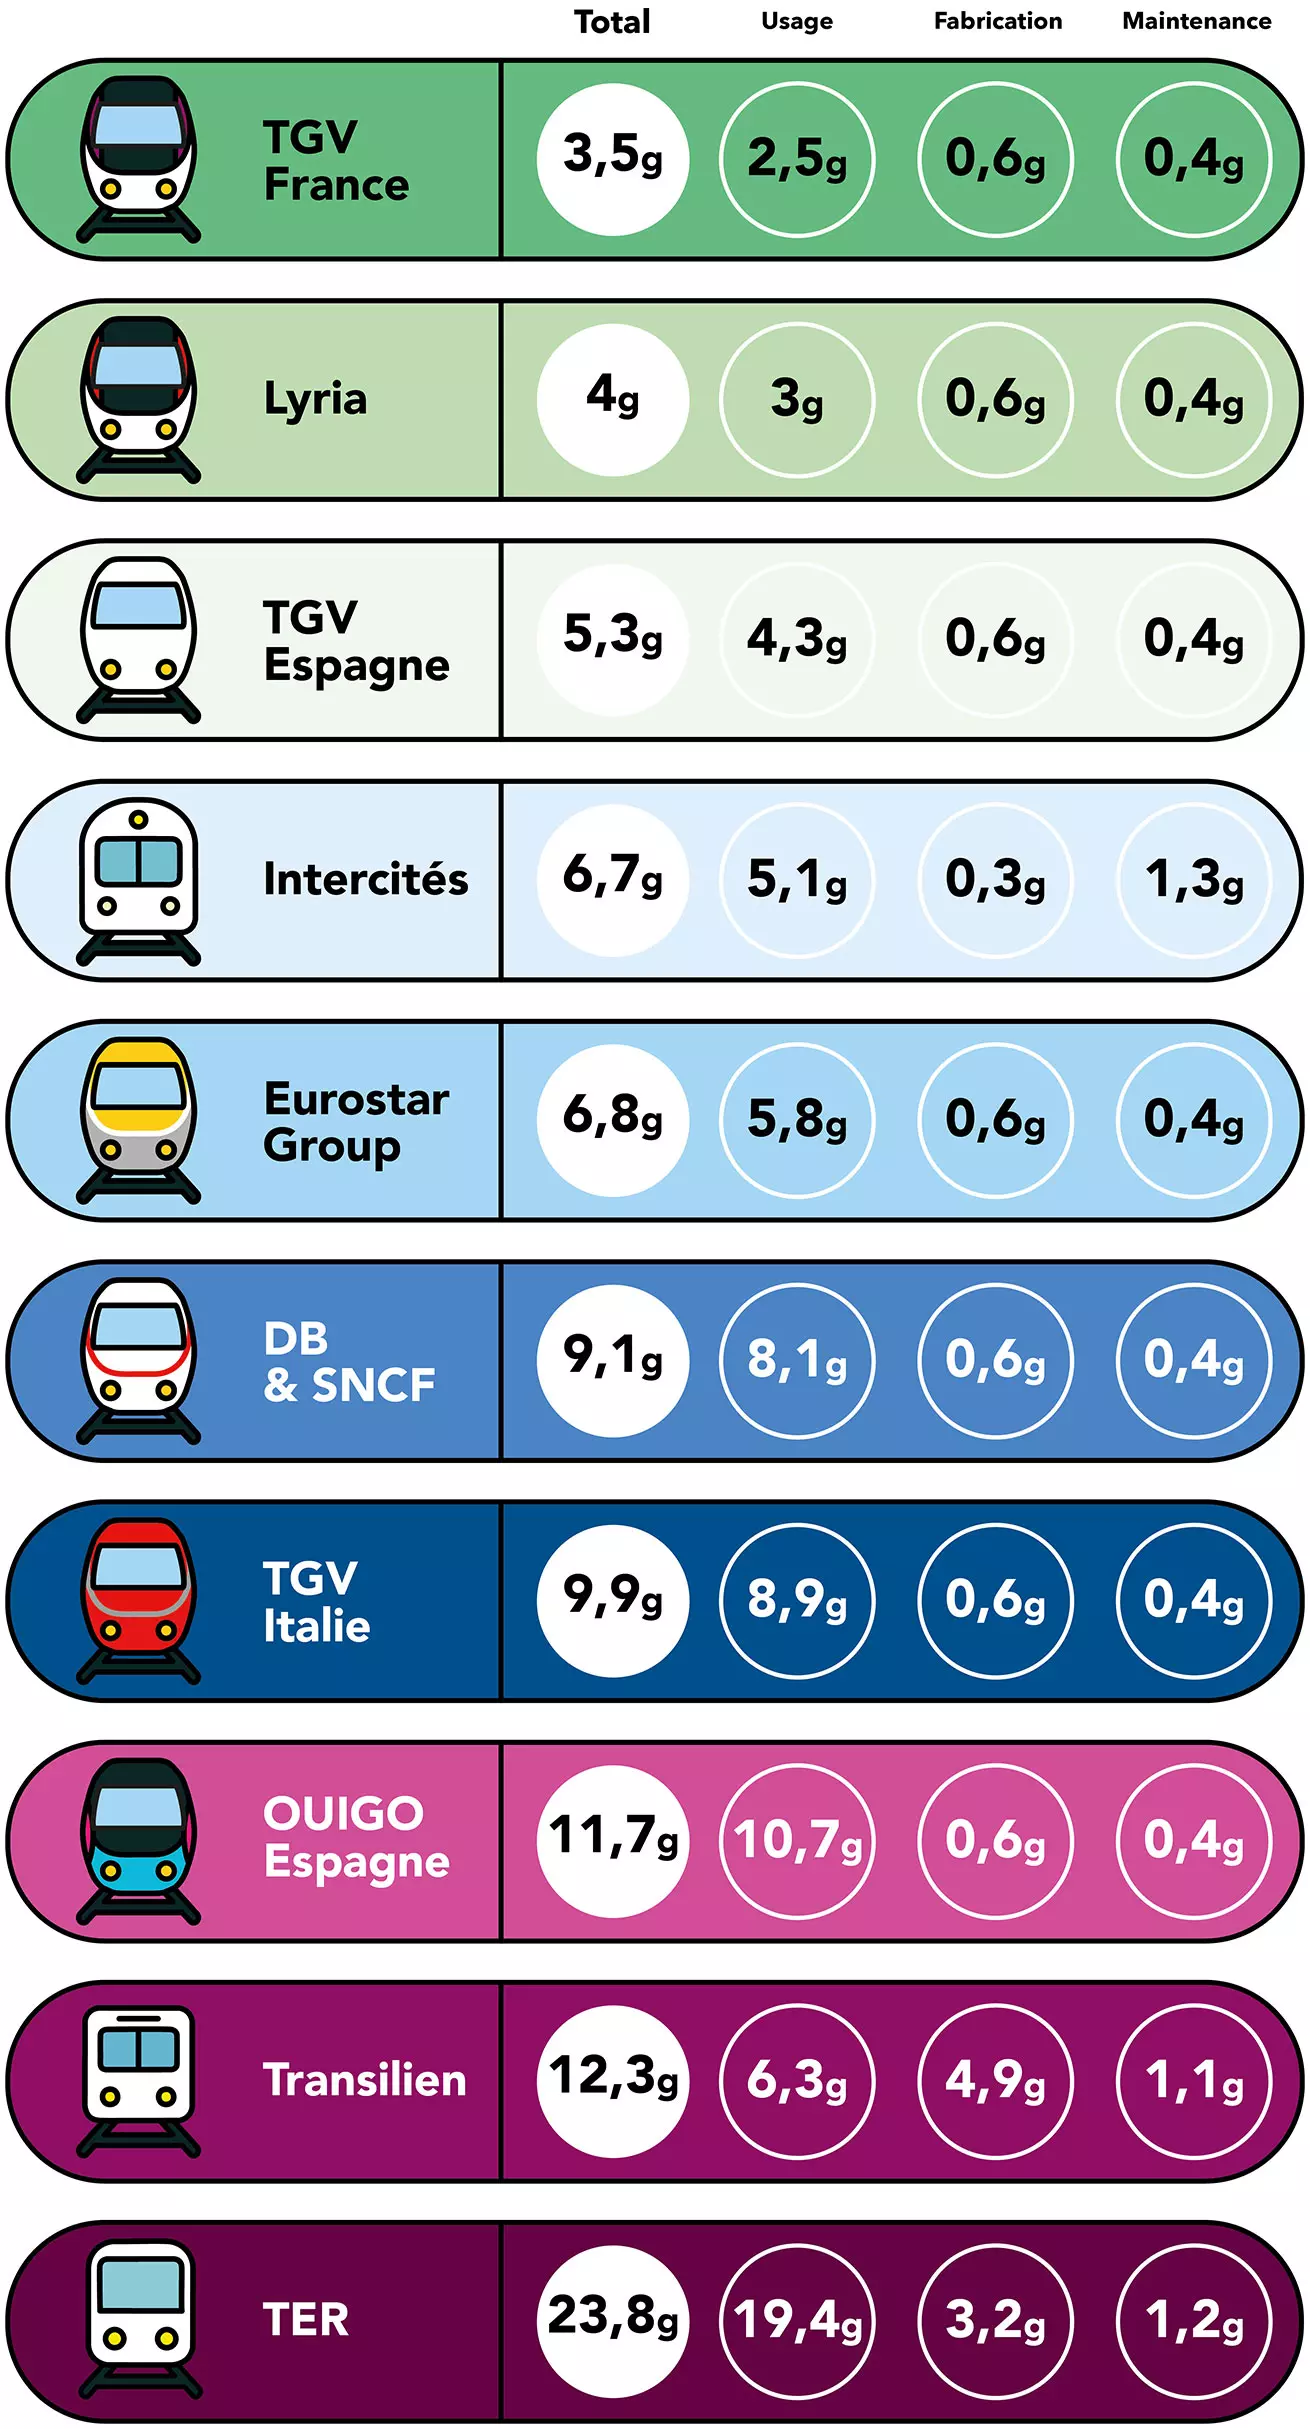
Table showing greenhouse gas emissions for a passenger traveling one kilometer in France, taking into account the impact of vehicle use, manufacture and maintenance.
Comparison of data, in ascending order:
- TGV France (3.5 grams of CO2e in total, including 2.5 grams of CO2e for use; 0.6 grams of CO2e for manufacture; 0.4 grams of CO2e for maintenance)
- Lyria (4 grams of CO2e in total, including 3 grams of CO2e for use; 0.6 grams of CO2e for manufacturing; 0.4 grams of CO2e for maintenance)
- TGV Spain (5.3 grams of CO2e in total, including 4.3 grams of CO2e for use; 0.6 grams of CO2e for manufacturing; 0.4 grams of CO2e for maintenance).
- Intercités (6.7 grams of CO2e in total, including 5.1 grams of CO2e for use; 0.3 grams of CO2e for manufacturing; 1.3 grams of CO2e for maintenance).
- Eurostar Group (6.8 grams of CO2e in total, including 5.8 grams of CO2e for use; 0.6 grams of CO2e for manufacturing; 0.4 grams of CO2e for maintenance)
- DB & SNCF (9.1 grams of CO2e in total, including 8.1 grams of CO2e for use; 0.6 grams of CO2e for manufacturing; 0.4 grams of CO2e for maintenance)
- TGV Italy (9.9 grams of CO2e in total, including 8.9 grams of CO2e for use; 0.6 grams of CO2e for manufacturing; 0.4 grams of CO2e for maintenance)
- OUIGO Spain (11.7 grams of CO2e in total, including 10.7 grams of CO2e for use; 0.6 grams of CO2e for manufacturing; 0.4 grams of CO2e for maintenance)
- Transilien (12.3 grams of CO2e in total, including 6.3 grams of CO2e for use; 4.9 grams of CO2e for manufacturing; 1.1 grams of CO2e for maintenance)
- TER (23.8 grams of CO2e in total, including 19.4 grams of CO2e for use; 3.2 grams of CO2e for manufacturing; 1.2 grams of CO2e for maintenance)
For SNCF Voyageurs transport modes, 2024 values for use, manufacturing and maintenance (maintenance-related emissions only include energy consumption used to maintain our trains).
The SNCF Voyageurs 2024 Modal Comparator Note is an explanatory note that describes how SNCF Voyageurs compares different modes of transport, based on their CO2e emissions.
Regulations and our method
TheCO2efootprint of a journey is calculated by multiplying the distance covered by the journey in question by the average quantity ofCO2eemitted per passenger per kilometer, depending on the mode of transport used.
The reference document, updated annually, is the Info GES Methodological Note, which includes information on emissions factors by mode of transport, emissions accounting perimeters and regulatory information.
Regulations require carriers, including SNCF Voyageurs, to provide passengers with CO2e data when they search for itineraries. This data can be consulted on the SNCF Voyageurs itineraries page of our website, after defining the route.
The calculation method
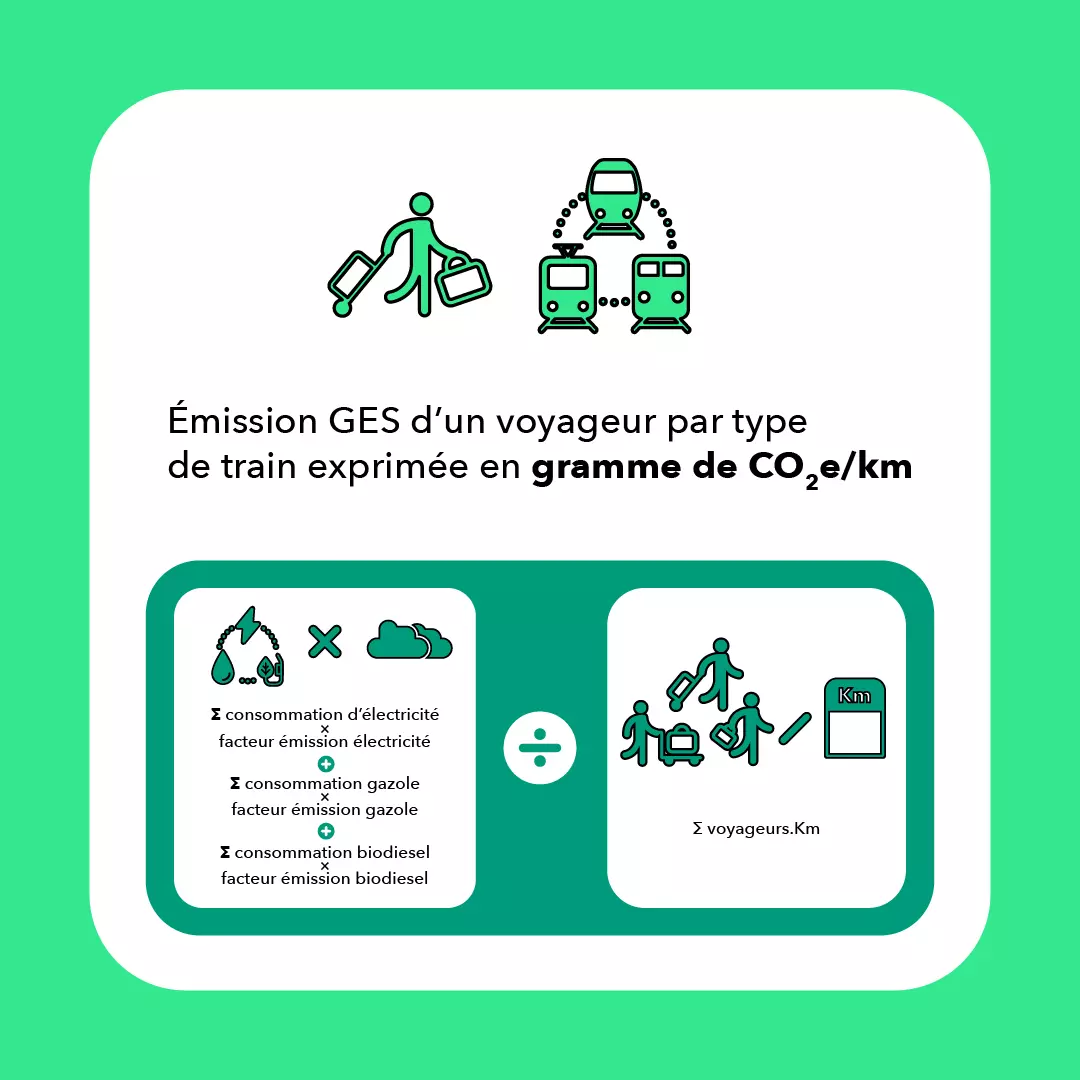
This diagram explains how the carbon footprint of a passenger by type of train is calculated.
On the upper part of the visual, pictograms showing a passenger and different trains with the following legend: GHG emissions of a passenger by type of train expressed in grams ofCO2e/Km.
On the lower part of the visual, pictograms illustrate the formula leading to the above result. This is the ratio between the consumption of electricity, diesel or biodiesel required for the journey in question, multiplied by theCO2e emission factor of the electricity, diesel or biodiesel, and the number of passengers carried over the distance covered.
This calculation is used each year to establish the average quantity ofCO2e emitted per type of transport per passenger.


Header : © ©ShutterStock
Long-distance carbon comparator (gCO2e/passenger/km) : © SNCF Voyageurs
Infographic : © SNCF Voyageurs / SNCF Voyageurs
The calculation method : © SNCF Voyageurs
Discover also : © Com à l'écran / ©SNCF Voyageurs / Alex Profit